Another day, another real estate story! And, oh man are things all over the place! The Bay Area real estate market is sending mixed signals left-and-right, making it more important than ever to stay informed and strategic. Let’s dive into the story behind the data and explore how different micro-markets are shaping up.
The Tale of Two Markets: Growth and Opportunity
As we analyze the market, it’s clear that micro-markets across the Bay Area are experiencing varied trends. Some neighborhoods are thriving, while others present ripe opportunities for those ready to act.
Peninsula’s Red-Hot Market:

Consider the Peninsula… some of the more “affordable” parts are on fire. In East Palo Alto, for example, the median price surged by 18% year-over-year. Similarly, San Mateo is witnessing a remarkable 16.4% YoY increase in median prices, and the number of sales has skyrocketed by 60.9% YoY. Anecdotally, this surge seems to be driven largely by people returning to the Bay Area for promising tech jobs, particularly in the AI sector.
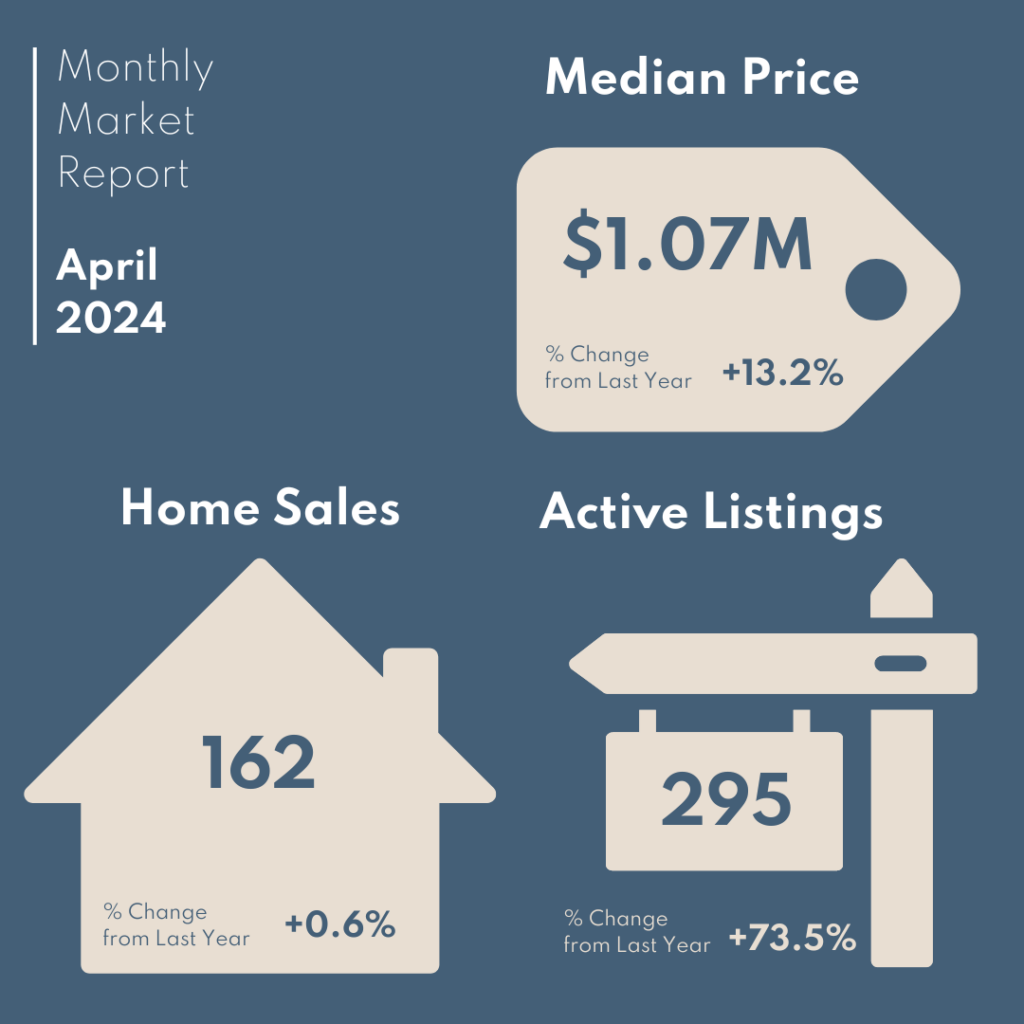
Opportunity Knocks in Oakland:
On the other hand, when we read between the lines, Oakland tells a slightly different story. While median prices are up by 13.2% YoY, the number of sales has remained relatively flat (only a 0.6% increase). However, and here’s the kicker…there is a significant 73.5% increase in active listings compared to last year. This influx of inventory suggests potential buying opportunities as properties sit on the market longer.
The San Francisco Conundrum:
San Francisco presents an interesting juxtaposition. When we look at the chart of median sales prices in SF since 2005, a dip becomes evident that is reminiscent of the financial crisis period. In hindsight, 2009-2012 were some of the best years to buy real estate in San Francisco, after prices had fallen a bit and just before they started their long and steady journey upward. Similarly, we saw a dip in the median prices from 2022-2023, with things currently looking to be on the upward trend. Of course, it is IMPOSSIBLE to time the market, but when you look at the chart of median prices over time, it feels like now is a good opportunity.
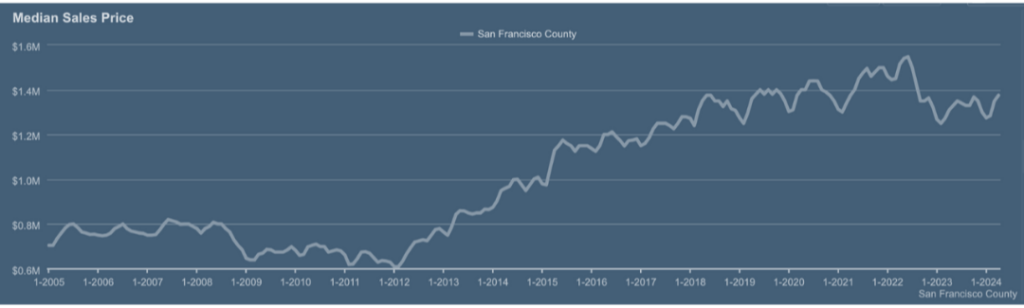
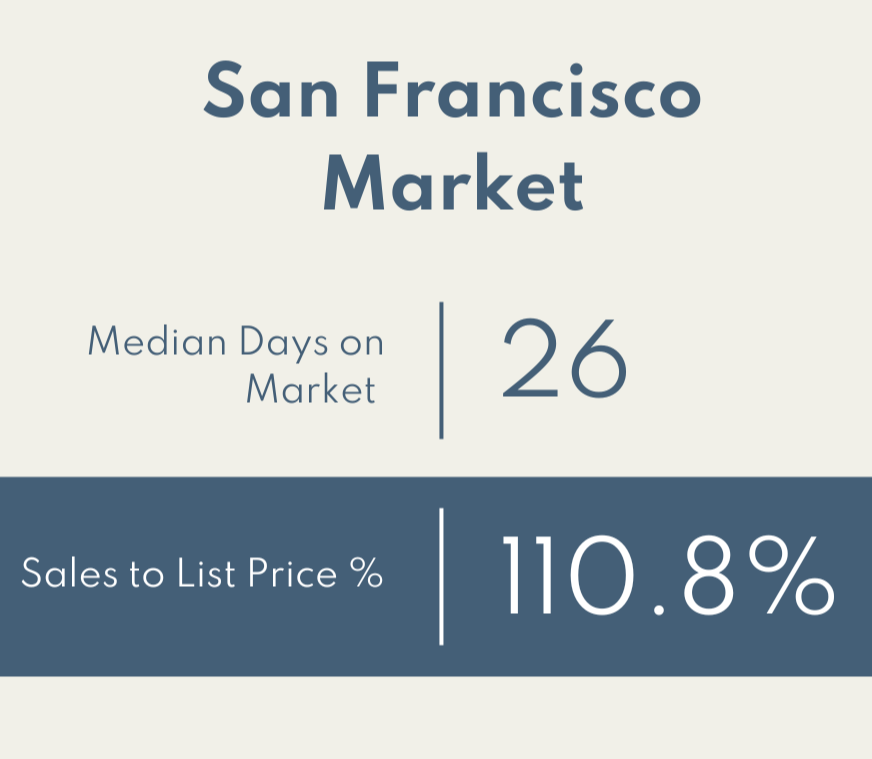
Although full disclosure – when you’re “out in the trenches,” we certainly understand that it might not feel that this is such a ‘great opportunity.’ Looking back to April 2024 month-wide data, on average, properties in SF were still trading a little over 110% above list price, mostly with multiple offers. This is why it’s important to zoom out and look at the bigger picture from the chart above.
Navigating the Luxury Market:
And, then, there’s the luxury market…While the volume of sales over $10M across CA is DOWN by 39% YoY, Silicon Valley leads the recovery in luxury homes sales — UP by almost two-thirds since last year. Again, this is pushed by a rallying stock market, continued investment in AI, and hyper-growth among some of the main players. Santa Clara County, home to Apple and Google, has had – by far – the most sales between $3-$5M this year (as of May 15th) with 590 transactions. And, it leads in the number of sales between $5-10 million (with 113 sales). Atherton, Woodside and Hillsborough are the biggest leaders in $10M/+ sales. San Francisco is also keeping pace in luxury sales, with 200 deals over $3M. Even more surprisingly, 40 of those were for condos, co-ops or TICs! It seems the vastly overdone ‘doom-loop’ stories are a thing of the past….

The Problem with National Headlines:
Real estate has always been hyper-local, but now, in particular (in this confusing time), it’s important to take national headlines with a grain of salt. For example, Robert Refkin, the CEO of Compass, recently stated that we are in a buyer’s market (nationally), with 30% of inventory seeing price drops — more than in any other time in the past decade.
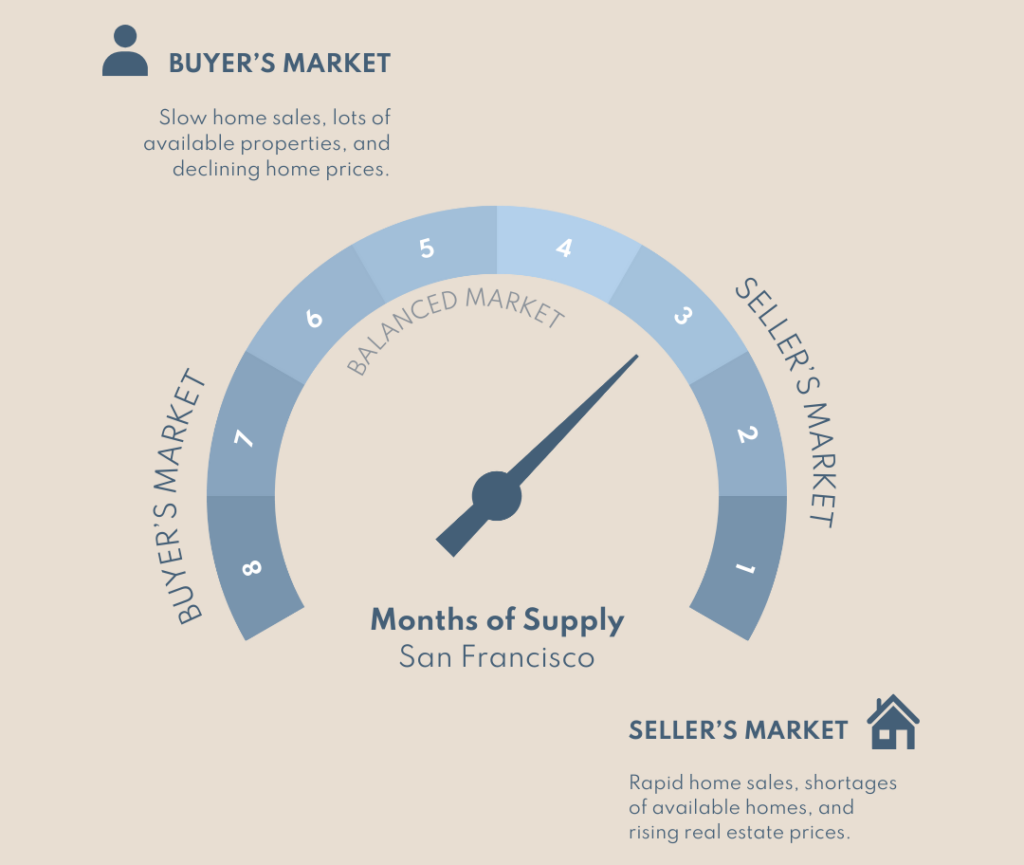
However…a ‘buyer’s market’ is defined as more than 6 months of inventory on the market at one time. Right now, in San Francisco (at large), we have 3 months supply (aka, if no new homes came on the market, we would “sell out” of homes in 3 months). Therefore, this falls under the definition of ‘a seller’s market.’ That said, micro-markets are at play here as well: Some parts of the city are seeing a stronger seller’s market (i.e., Bernal Heights and the Richmond), while other parts have tipped / are tipping towards a buyer’s market (i.e., Nob Hill, and South Beach).
Final Thoughts
Here’s the deal: the real estate market is constantly evolving, presenting both challenges and opportunities. Just when you finish reading this report, the latest data has probably already changed.
So what do you do? Here’s the best advice we can offer
Understand your goals and priorities, and let's have a targeted conversation about your needs and the micro-markets that can satisfy those needs.
We are tracking these trends daily to look for opportunities across the Bay Area. Reach out if you want to chat!