OUR INSIDER'S PERSPECTIVE
That’s enough about us! Now, back to the data and insights that you want right now…
Here’s our TL;DR for you: The temperatures aren’t the only thing on the rise right now: We’re seeing inventory start to slowly tick up (aka more choices for buyers), and we’re seeing opportunistic buyers jumping in before “it’s too late,” (as they say).
Earlier this week, we saw a UBS Private Wealth report, indicating that come mid-September, we will hit the highest point of pent up housing demand, as measured by housing supply, compared to demand!
So, speaking of heating up…all eyes are on the 2nd half of 2024 (particularly post election) and 2025! Let’s dive deeper into the Bay Area numbers, as well as some stories from recent wins…
BY THE NUMBERS
1. Inventory is slowly heating up!
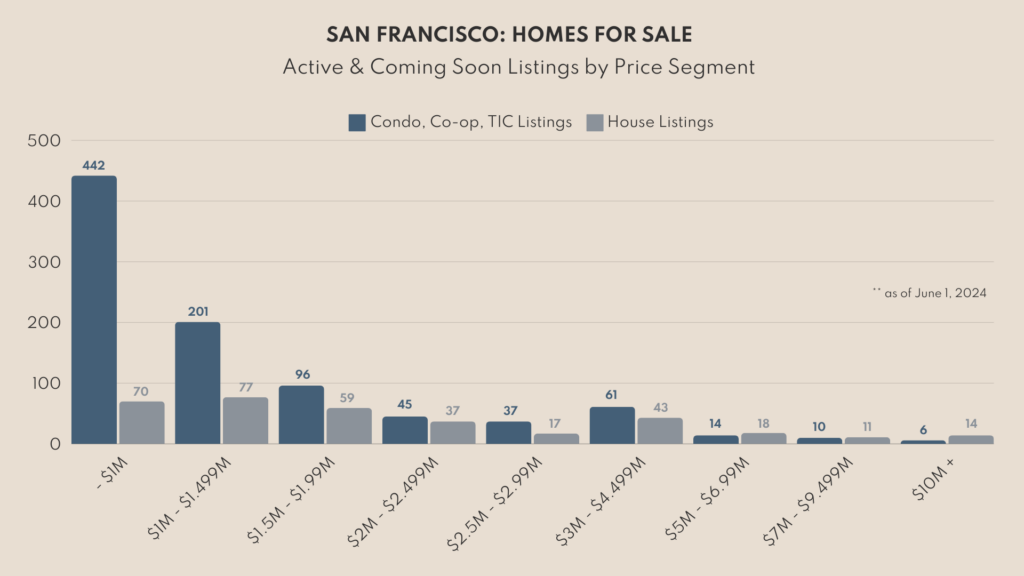
Over the past few months, we’ve observed a 7% increase in inventory across the Bay Area. This trend is particularly evident in the sub-$1M price segment, which currently holds 35% of the total inventory. This rise in inventory presents a golden opportunity for buyers to finally have a wider range of options. For sellers, this means a slightly more competitive market which means pricing strategy and home presentation are more crucial than ever.
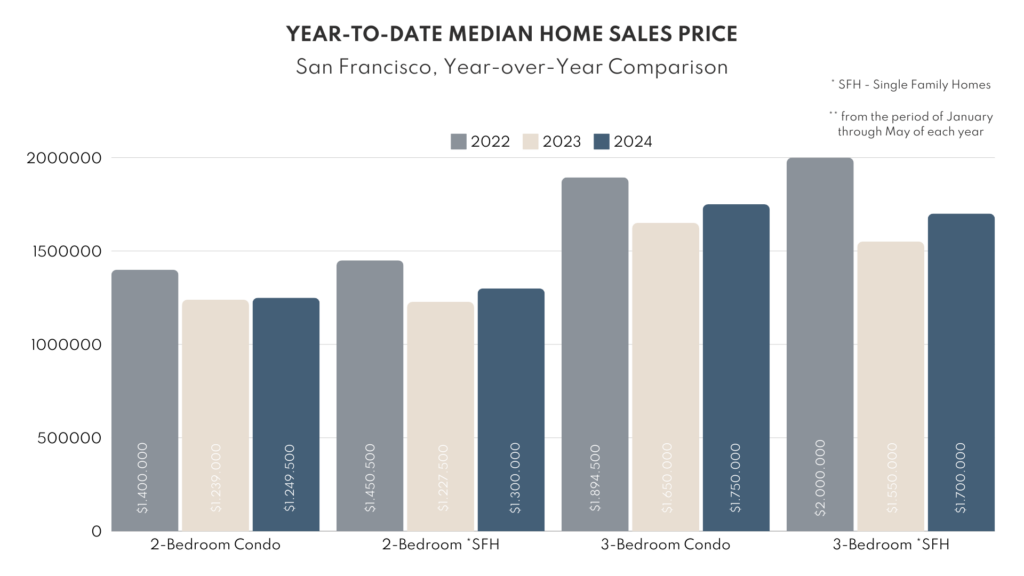
2. Transaction Volume is Hotter than Last Year
Transaction volume across the Bay has seen a notable 12% YoY uptick, especially in the luxury real estate segment. In fact, compared to the same period last year, we’ve experienced a 15% increase in transaction volume for properties priced above $3M. This surge indicates a robust interest in high-end properties, driven by both local and international buyers. Here are the numbers for San Francisco, which are directionally consistent to other markets across the Bay as well:
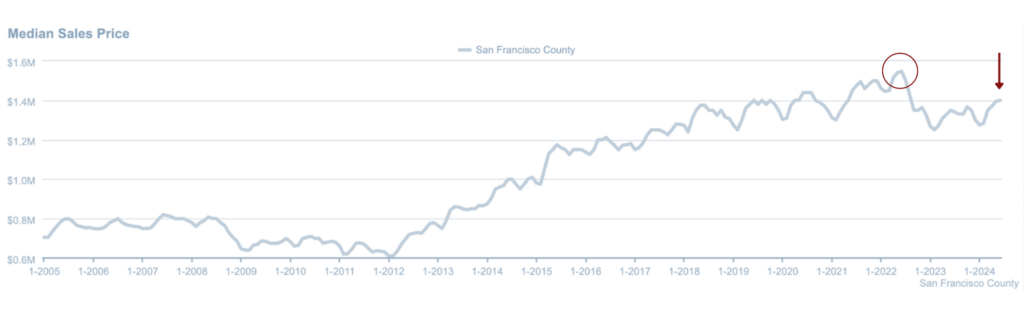
3. Prices - on Average - Remain Luke Warm, But Below the 2022 Peak:
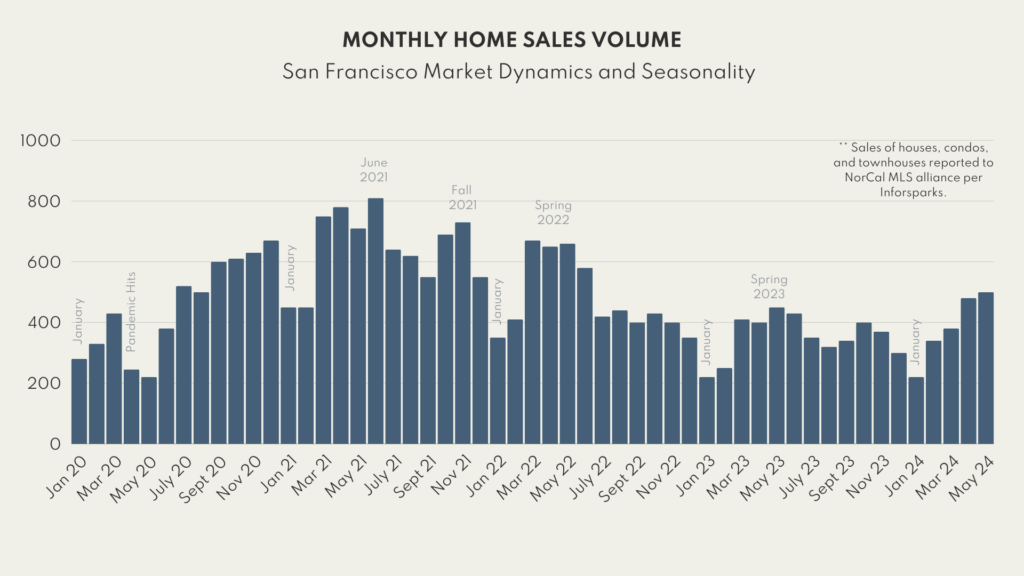
While prices have been gradually recovering, they remain 8% (on average, across the Bay), below the peak levels of early 2022. That peak was primarily driven by buyers rushing to secure properties before expected rate hikes. Here’s a graph showcasing this for SF, as an illustrative example:
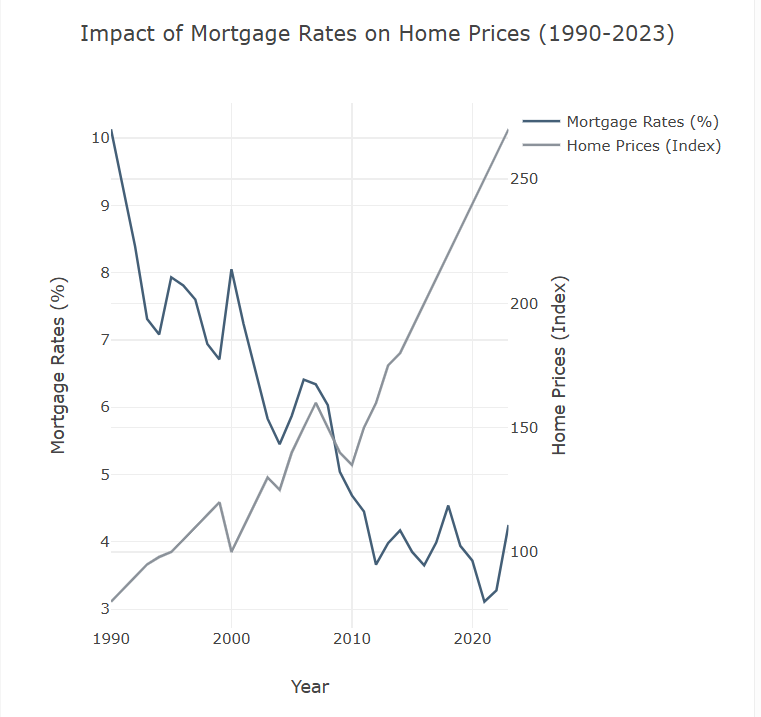
And, a Note on Interest Rates and Home Prices...
Throughout history, as rates come down, the home prices tend to have the inverse effect, although this is not a strict rule and can be influenced by various economic factors, like employment rates, inflation, the stock market, amount of housing supply, and government policies. That said, here are some clear examples of this in action. In the:
- Early 1980s, high mortgage rates (up to 18%) led to a significant slowdown in the housing market and lower home price appreciation.
- Early 2000s, low mortgage rates contributed to a housing boom, with rapidly rising home prices.
- Post-2008 Financial Crisis, the FED kept mortgage rates low to stimulate the economy, leading to a gradual recovery in home prices.
All of this to say, we’ve found that many of our buyers are looking opportunistically right now, seeing this as a favorable window to invest before the market potentially heats up again.
And, the FED is now showing some good indicators that a September rate cut is certainly on the table, so time will tell… (We know we’ve been saying this for a long time, so we’re of the mindset, “we’ll believe it when we see it!”)
Macro Economic Indicators:
On a broader scale, the macroeconomic environment is still showing mixed signals. On one hand, both the general and “core” inflation rates just dropped to their lowest points in over 3 years. (Caveat: they are still above the Fed’s target rate of 2%.) While there continues to be some volatility, the stock market continues to be strong, which certainly influences wealth in the Bay Area, in particular.
Many of the macroeconomic factors contribute to the cautious optimism in the real estate market. Understanding these indicators – and other KPIs – can help you make more informed decisions about when and how to invest in real estate!
STORYTIME: OUR COLLECTIVE WINS
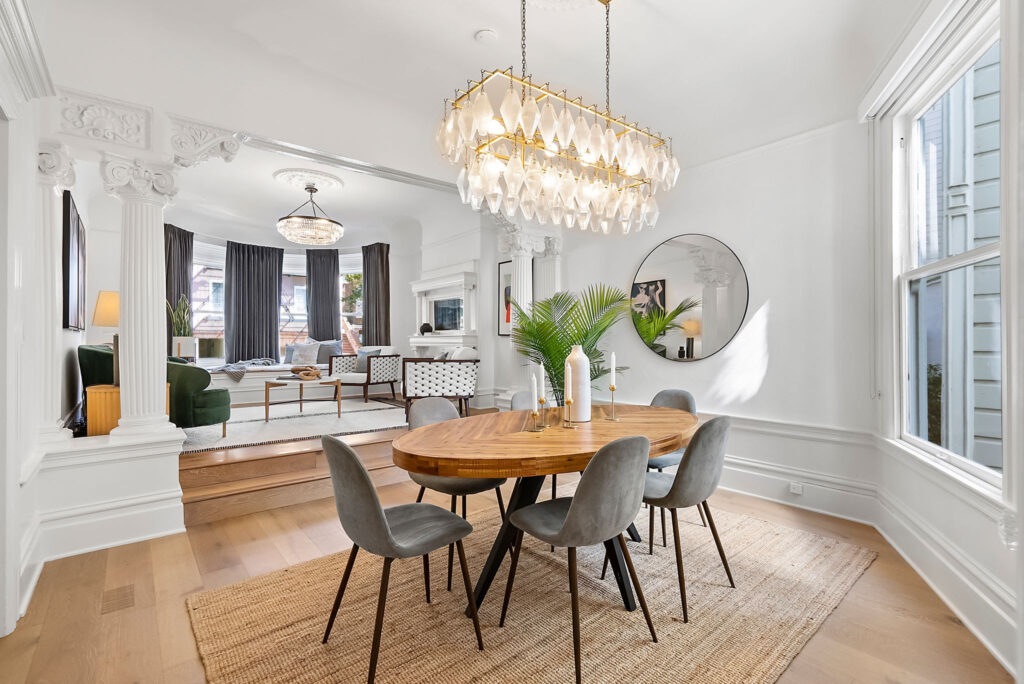
SOLD - $3.2M | 6 BEDS | 6 BATHS
Most other agents wouldn’t touch this property and/or told our clients (the sellers) it would take 2 years to sell. Well, we sold it in 2 months! This property was under litigation and had an estimated $1.5m of known construction defects, discovered after our clients bought it (We didn’t represent them on the buy side). We hate that they had to go through this situation, but we’re thrilled that they can now close out the lawsuit settlement and move on with their life!
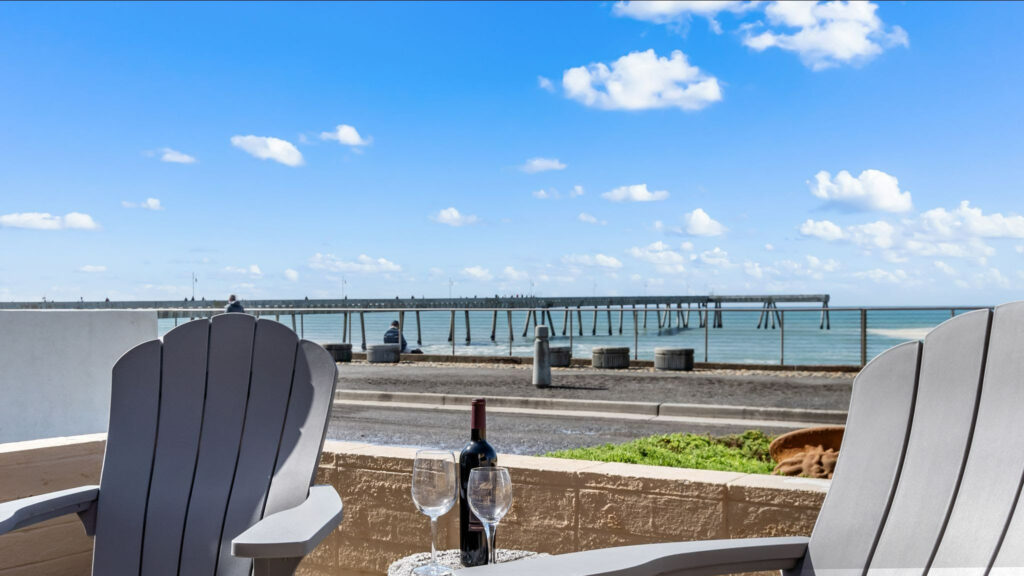
SOLD - $1.365M | 1+ BED | 2 BATHS
We successfully sold this darling ocean-front property for one of the top 3 highest price per square foot EVER in Pacifica!! And – no huge surprise – the buyer came from out of the area. This is one of the key reasons why we work across such a large geographical area. Fun fact: of all of our listings in 2023, all but 1 of them had a buyer that we sourced from out of the area of the property itself! Turns out, our broad approach works 🙂
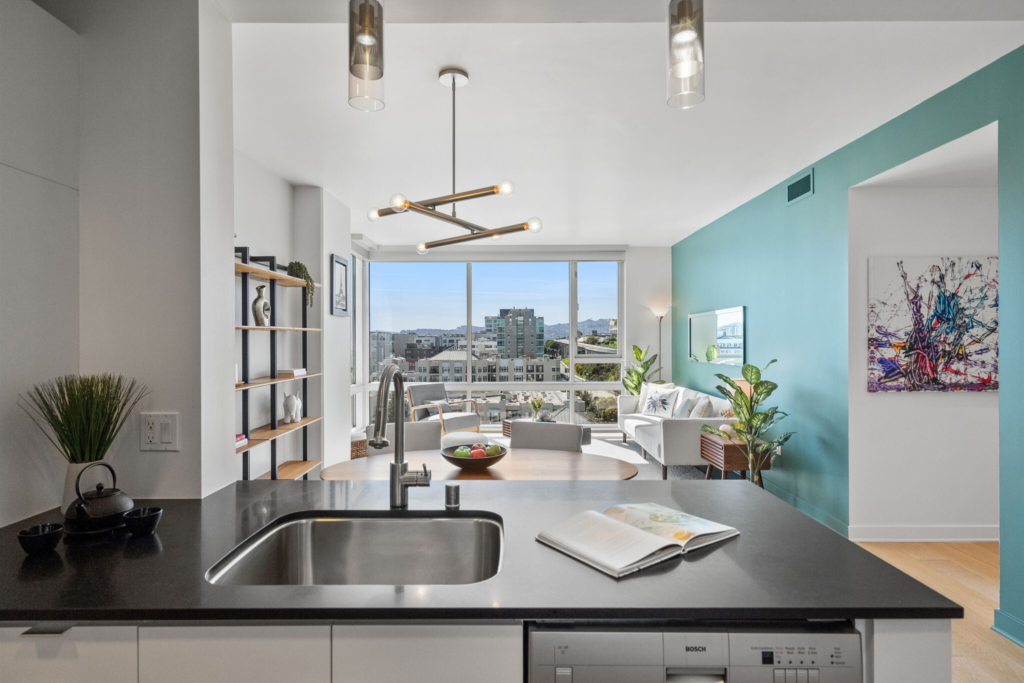
SOLD - $2.6M | 3 BEDS | 2.5 BATHS
After a short 2 year ownership in this property (life had different plans), we sold this property for $350k more than they paid! And, what’s even better…we got into contract within 3 days after going to market for $350k over asking, all cash, and a quick close! Money in the bank!
SOLD - $1.130M | 2 BEDS | 2 BATHS
We successfully got this bad boy into contract within 2 days after being on the market for over list price AND with a 60 day free rent back for our clients. We managed to do it all while they were living in the home! PS: The average days on market for other units in this building and the surrounding comps is 200+ – and under asking. We love blowing the stats out of the water!